# Debugging in Chrome
Before going further, let's talk about debugging.
All modern browsers and most other environments support "debugging" -- a special UI in developer tools that makes finding and fixing errors much easier.
We'll be talking about Chrome here, because they are probably the most feature-rich.
[cut]
## The "sources" pane
Your Chrome version may look a little bit different, but it still should be obvious what's there.
- Open the [example page](debugging/index.html) in Chrome.
- Turn on developer tools with `key:F12` (Mac: `key:Cmd+Opt+I`).
- Select the `sources` pane.
Here's what you should see if you are doing it for the first time:
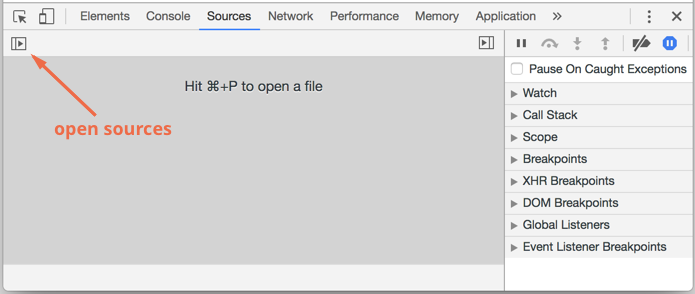
The toggler button opens the tab with files.
Let's click it and select `index.html` and then `hello.js` in the tree view. That's what should show up:
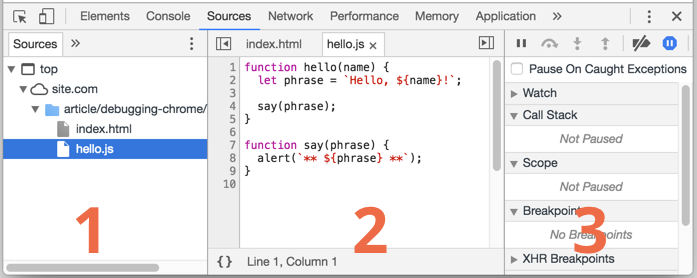
Here we can see three zones:
1. **Resources zone** lists html, javascript, css and other files including images that are attached to the page. Currently active chrome extensions may appear here too.
2. **Source zone** shows the source code.
3. **Information and control zone** is for debugging, we'll explore it later.
Now you could click the same toggler again to hide the resources list, as we won't need it soon.
## Console
If we press `Esc`, then a console opens below, to type commands into.
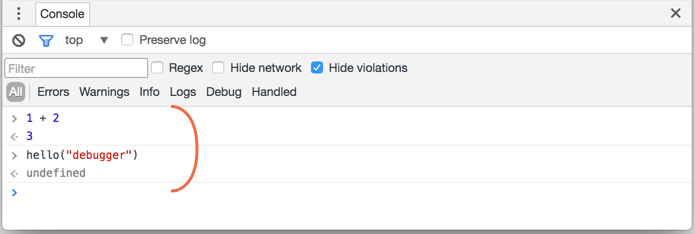
After a statement is executed, its result is shown.
For example, here `1+2` results in `3` and `hello("debugger")` call shows a message, but there's no result, so it's `undefined`:
## Breakpoints
Let's examine what's going on within the code. In `hello.js`, click at the line number `4`, right on the `4` digit.
Contratulations! You've set a breakpoint. Please also click on the number for line `8`.
Should look like this:

A *breakpoint* is a point of code where the debugger will automatically pause the JavaScript execution.
While the code is paused, we can examine current variables, execute commands in the console etc. That is -- debug it.
Breakpoints also show in the right pane. We can always find a list of breakpoints there.
It allows to:
- Quickly jump to the breakpoint in the code (by clicking on it in the right pane).
- Temporarily disable the breakpoint by unchecking it.
- Remove the breakpoint by right-clicking the text and selecting Remove.
- ...And so on.
````smart header="Breakpoint alternatives"
- We can make debugger to pause the code by using the `debugger` command, like this:
```js
function hello(name) {
let phrase = `Hello, ${name}!`;
*!*
debugger; // <-- the debugger stops here
*/!*
say(phrase);
}
```
- *Right click* on the line number allows to create a conditional breakpoint. It only triggers when a given expression is truthy.
That's handy when we need to stop only for a certain variable value or for a certain function parameters.
````
## Pause and look around
In our example, `hello()` is called during page load, so the easiest way to activate debugger -- is to reload the page. So let's press `key:F5` (Windows, Linux) or `key:Cmd+R` (Mac).
As the breakpoint is set, the execution pauses at the 4th line:

Please open the informational dropdowns to the right (labelled with arrows). They allow to examine the current code state:
1. **`Watch` -- shows current values for any expressions.**
You can click the plus `+` and input an expression. The debugger will shown its value at any moment, automatically recalculating it in in the process.
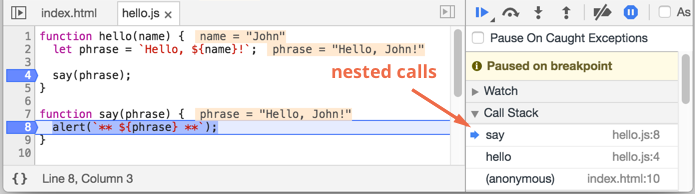
2. **`Call Stack` -- shows the nested calls chain.**
At the current moment the debugger is inside `hello()` call, called by a script in `index.html` (no function there).
If you click the item there, the debugger jumps to the corresponding code, and all its variables can be examined as well.
3. **`Scope` -- current variables.**
`Local` shows local function variables. You can also see their values highlighted right over the source.
`Global` has global variables (out of any functions).
There's also `this` keyword there that we didn't study yet, but we'll do that soon.
## Tracing the execution
Now let's time to *trace* the script.
There are buttons for it at the right-top:
-- continue the execution, hotkey `key:F8`.
: Resumes the execution. If there are no additional breakpoints, then the execution just continues and the debugger looses the control.
Let's click it:
The execution has resumed, reached another breakpoint inside `say()` and paused there. Take a look at the "Call stack" at the right. It has increased by one more call. We're inside `say()` now.
-- make a step (run the next command), but *not go into the function*, hotkey `key:F10`.
: If we click it now, `alert` will be shown. The important thing is that if `alert` were not native, but a JavaScript function, then the execution would "step over it", skipping the function internals.
-- make a step, hotkey `key:F11`.
: The same as the previous one, but "steps in" nested functions. Clicking this will step through all script actions one by one.
-- continue the execution till the end of the current function, hotkey `key:Shift+F11`.
: The execution would stop at the very last line of the current function. That's handy when we accidentally entered a nested call using , but it does not interest us and we want to continue to its end as soon as possible.
-- enable/disable all breakpoints.
: That button does not move the execution. Just a mass on/off for breakpoints.
-- enable/disable automatic pause in case of an error.
: When it's enabled (by default it is), an error pauses the execution and we can analyze variables to see what went wrong. So if our script dies with error, we can open debugger and reload the page to see where it stopped and what was the context at that moment.
```smart header="Continue to here"
Right click on the line number opens the contextual menu where we can "Continue to here". That's handy when we want to move multiple steps forward, but too lazy to set a breakpoint.
```
## Logging
To output something to console, there's `console.log` function.
For instance, this logs values from `0` to `4`:
```js run
// open console to see
for (let i = 0; i < 5; i++) {
console.log("value", i);
}
```
To see the output, you can either switch to "Console" tab in developer tools or press `key:Esc` while in another tab: that opens the console at the bottom.
That's called "logging". If we have enough logging in our code, then we can see what's going on from the records, without the debugger.
## Summary
As we can see, there are 3 main ways to pause a script:
1. A breakpoint.
2. The `debugger` statements.
3. An error (if dev tools are open and the button is "on")
Then the debugging process usually consists of examining variables and stepping on to see where the execution goes the wrong way.
There's much more power in developer tools.
The better manual is at
The information from this chapter is enough to begin debugging, but later, especially if you are doing in-browser stuff, please go there and look through more advanced capabilities of developer tools.
Oh, and also you can click at various places of dev tools and just see what's showing up. That's probably the fastest route to learn dev tools. Don't forget about the right click as well!